


National Bureau of Statistics of China
15 July 2021
In the first half-year, faced with a complicated and changing environment both at home and abroad, under the strong leadership of the CPC Central Committee with Comrade Xi Jinping at the core, all regions and departments strictly implemented the decisions and arrangements made by the CPC Central Committee and the State Council, continued to consolidate and expand the achievements made in the epidemic prevention and control and the economic and social development, and implemented accurate macro policies. China’s economy sustained a steady recovery with the production and demand picking up, employment and prices remaining stable, new driving forces thriving fast, quality and efficiency-enhancing, market expectations improving, and major macro indicators staying within a reasonable range. The national economy witnessed the steady and sound growth momentum consolidated.
According to the preliminary estimates, the gross domestic product (GDP) of China in the first half-year was 53,216.7 billion yuan, a year-on-year increase of 12.7 percent at comparable prices, 5.6 percentage points lower than that of the first quarter; and the average two-year growth was 5.3 percent, 0.3 percentage points faster than that of the first quarter. By quarter, the year-on-year GDP growth for the first quarter was 18.3 percent, with an average two-year growth of 5.0 percent; for the second quarter 7.9 percent, with an average two-year growth of 5.5 percent. By industry, in the first half-year, the value-added of the primary industry was 2,840.2 billion yuan, a year-on-year growth of 7.8 percent, with an average two-year growth of 4.3 percent; the secondary industry 20,715.4 billion yuan, a year-on-year growth of 14.8 percent, with an average two-year growth of 6.1 percent; and the tertiary industry 29,661.1 billion yuan, a year-on-year growth of 11.8 percent, with an average two-year growth of 4.9 percent. The quarter-on-quarter GDP growth of the second quarter was 1.3 percent.
1.Summer Grain Witnessed Another Bumper Harvest and Production of Animal Husbandry Grew Steadily.
In the first half-year, the value-added of agriculture (crop farming) went up by 3.6 percent year-on-year, 0.3 percentage points faster than that of the first quarter, with an average two-year growth of 3.7 percent. Specifically, that of the second quarter grew by 3.7 percent, 0.4 percentage points faster than that of the first quarter. The overall output of summer grain was 145.82 million tons (291.6 billion jin), 2.967 million tons (5.93 billion jin) higher than that of last year, an increase of 2.1 percent. The structure of crop farming continued to optimize, as sown area for cash crops like rapeseeds increased. In the first half year, the output of pork, beef, mutton, and poultry was 42.91 million tons, up by 23.0 percent over the same period last year. Specifically, the output of pork increased by 35.9 percent; milk, up by 7.6 percent; eggs, down by 4.1 percent. By the end of the second quarter, 439.11 million pigs were registered in stock, a year-on-year growth of 29.2 percent; specifically, 45.64 million were breeding sows, up by 25.7 percent.
2.Industrial Production Grew Steadily and High-tech Manufacturing Grew Fast.
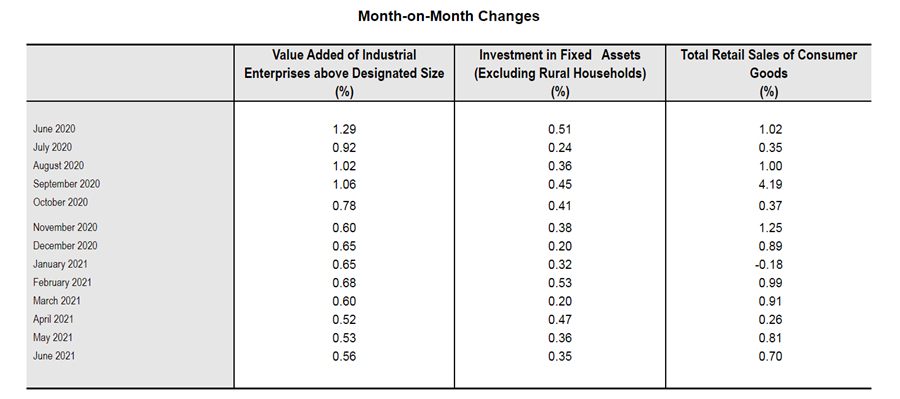
In the first half year, the total value added of the industrial enterprises above the designated size grew by 15.9 percent year-on-year, with an average two-year growth of 7.0 percent, 0.2 percentage points faster than that of the first quarter; specifically, that of the second quarter went up by 8.9 percent year-on-year. In June, the total value added of the industrial enterprises above the designated size grew by 8.3 percent year-on-year, with an average two-year growth of 6.5 percent; and the month-on-month growth was 0.56 percent. In terms of sectors, in the first half year, the value added of the mining went up by 6.2 percent year-on-year, with an average two-year growth of 2.5 percent; that of the manufacturing up by 17.1 percent, with an average two-year growth of 7.5 percent; and that of the production and supply of electricity, thermal power, gas, and water up by 13.4 percent, with an average two-year growth of 6.0 percent. The value added of high-tech manufacturing went up by 22.6 percent year-on-year, with an average two-year growth of 13.2 percent. In terms of products, the production of new-energy automobiles, industrial robots and integrated circuits increased by 205.0 percent, 69.8 percent, and 48.1 percent year-on-year respectively, with the average two-year growths all exceeding 30 percent. An analysis by types of ownership showed that the value added of the state holding enterprises went up by 11.9 percent year-on-year; that of share-holding enterprises up by 15.8 percent year-on-year; that of enterprises funded by foreign investors or investors from Hong Kong, Macao, and Taiwan up by 17.0 percent year-on-year; and that of private enterprises up by 18.3 percent year-on-year. In June, the Manufacturing Purchasing Managers’ Index of China was 50.9 percent, staying above the threshold for sixteen months in a row. The Production and Operation Expectation Index was 57.9 percent.
In the first five months, the total profits made by industrial enterprises above the designated size was 3,424.7 billion yuan, up by 83.4 percent year-on-year, with an average two-year growth of 21.7 percent. The profit rate of the business revenue of industrial enterprises above the designated size was 7.11 percent, 2.05 percentage points higher than that of the first five months in 2020.
3.Service Sector Recovered Steadily with Market Expectation Picking Up.
The first half year witnessed a steady recovery of the tertiary industry. Specifically, the value added of the tertiary industry for the second quarter increased by 8.3 percent year-on-year, with an average two-year growth of 5.1 percent; that for the first quarter increased by 15.6 percent year-on-year, with an average two-year growth of 4.7 percent. Specifically, in the first half year, the value added of transportation, storage and postal services and information transmission, software and information technology services increased by 21.0 percent and 20.3 percent year-on-year respectively, with the average two-year growths increased by 6.9 percent and 17.3 percent respectively. In June, the Index of Services Production increased by 10.9 percent year-on-year, with an average two-year growth of 6.5 percent. In the first five months, business revenue of service enterprises above the designated size went up by 31.9 percent year-on-year, with an average two-year growth of 11.1 percent, 0.2 percentage points higher than that of the first four months.
In June, the Business Activity Index for services was 52.3 percent, staying above the threshold for sixteen months in a row. Specifically, the Business Activity Index for sectors closely related with online consumption such as express mail services, telecommunication, broadcast, television, and satellite transmission services, internet, software, and information services stayed within the expansion range of 57.0 percent and above; monetary and financial services and insurance stood within the expansion range of 60.0 percent and above. In terms of the market expectation, the Business Activities Expectation Index was 60.4 percent, continuing to stay within the expansion range.
4.Market Sales Improved Gradually and Sales of Upgraded Consumer Goods Witnessed Accelerated Growth.
In the first half-year, the total retail sales of consumer goods reached 21,190.4 billion yuan, up by 23.0 percent year-on-year, with an average two-year growth of 4.4 percent, 0.2 percentage points faster than that of the first quarter; specifically, that of the second quarter went up by 13.9 percent year-on-year with an average two-year growth of 4.6 percent. In June, the total retail sales of consumer goods reached 3,758.6 billion yuan, up by 12.1 percent year-on-year, with an average two-year growth of 4.9 percent, or up by 0.70 percent month on month. In the first half-year, analyzed by different areas, the retail sales of consumer goods in urban areas reached 18,409.8 billion yuan, up by 23.3 percent year-on-year with an average two-year growth of 4.4 percent, and the retail sales of consumer goods in rural areas stood at 2,780.7 billion yuan, up by 21.4 percent with an average two-year growth of 4.0 percent. Grouped by consumption patterns, the retail sales of goods reached 19,019.2 billion yuan, up by 20.6 percent year-on-year with an average two-year growth of 4.9 percent; the revenue of catering was 2,171.2 billion yuan, up by 48.6 percent, same as that of the first half of 2019. Group by categories, the year-on-year growth rates for 18 categories of goods by enterprises above the designated size all exceeded 10 percent, among which, over 70 percent of categories of goods witnessed their year-on-year growth rates exceeding 20 percent. In terms of the average two-year growth, except petroleum products, retail sales of other categories of goods all witnessed positive growth; specifically, that of nine categories including sports and recreational articles, communication equipment, cosmetics, and cultural and office supplies exceeded 10 percent. The online retail sales reached 6,113.3 billion yuan, a year-on-year growth of 23.2 percent with an average two-year growth of 15.0 percent, or 1.5 percentage points faster than that of the first quarter. Specifically, the online retail sales of physical goods were 5,026.3 billion yuan, up by 18.7 percent with an average two-year growth of 16.5 percent, or 1.1 percentage points faster than that of the first quarter, accounting for 23.7 percent of the total retail sales of consumer goods, or 1.8 percentage points higher than that of the first quarter.
5.Investment in Fixed Assets Continued to Recover and the Average Two-year Growth Rate of Investment in Manufacturing Accelerated.
In the first half-year, the investment in fixed assets (excluding rural households) reached 25,590.0 billion yuan, up by 12.6 percent year-on-year, and it grew by 0.35 percent month on month in June. The average two-year growth reached 4.4 percent, 1.5 percentage points faster than that of the first quarter. Specifically, in the first half-year, the investment in infrastructure was up by 7.8 percent year-on-year with an average two-year growth of 2.4 percent, a slight decrease compared with the first five months; manufacturing up by 19.2 percent year-on-year with an average two-year growth of 2.0 percent, 1.4 percentage points faster than the first five months; real estate development up by 15.0 percent year-on-year with an average two-year growth of 8.2 percent, a slight decrease compared with the first five months. The floor space of commercial buildings sold reached 886.35 million square meters, up by 27.7 percent year-on-year with an average two-year growth of 8.1 percent. The total sales of commercial buildings were 9,293.1 billion yuan, up by 38.9 percent year-on-year, with an average two-year growth of 14.7 percent. The investment in the primary industry went up by 21.3 percent year-on-year with an average two-year growth of 13.2 percent; the secondary industry up by 16.3 percent year-on-year with an average two-year growth of 2.9 percent; and the tertiary industry up by 10.7 percent year-on-year with an average two-year growth of 4.8 percent. The private investment was up by 15.4 percent year-on-year with an average two-year growth of 3.8 percent. The investment in high-tech industries grew by 23.5 percent year-on-year with an average two-year growth of 14.6 percent, of which the investment in high-tech manufacturing and high-tech services increased by 29.7 percent and 12.0 percent year-on-year respectively and their average two-year growths reached 17.1 percent and 9.5 percent. In terms of high-tech manufacturing, the investment in manufacturing of computers and office equipment and in manufacturing of medical equipment, measuring instrument, and equipment grew by 47.5 percent and 34.2 percent year-on-year respectively and their average two-year growths reached 26.3 percent and 18.7 percent. In terms of high-tech services, the investment in e-commerce services and research, development, and design services went up by 32.9 percent and 28.4 percent year-on-year and their average two-year growths reached 32.5 percent and 15.9 percent. The investment in social sectors went up by 16.4 percent year-on-year with an average two-year growth of 10.7 percent, among which the investment in health sector and education went up by 35.5 percent and 14.2 percent year-on-year with average two-year growths of 24.9 percent and 12.5 percent.
6.Imports and Exports of Goods Grew Fast and Trade Structure Continued to Improve.
In the first half-year, the total value of imports and exports of goods was 18,065.1 billion yuan, an increase of 27.1 percent year-on-year. The total value of exports was 9,849.3 billion yuan, up by 28.1 percent year-on-year. The total value of imports was 8,215.7 billion yuan, up by 25.9 percent year-on-year. The trade balance was 1,633.6 billion yuan in surplus. The trade structure continued to improve. In the first half-year, the exports of mechanical and electrical products accounted for 59.2 percent of the total value of exports, up by 0.6 percentage points over the same period last year. The imports and exports of general trade accounted for 61.9 percent of the total value of imports and exports, up by 1.7 percentage points over the same period last year. The imports and exports by private enterprises accounted for 47.8 percent of the total value of imports and exports, up by 2.8 percentage points over the same period last year. In June, the total value of imports and exports was 3,291.6 billion yuan, an increase of 22.0 percent year-on-year. The total value of exports was 1,812.2 billion yuan, up by 20.2 percent year-on-year. The total value of imports was 1,479.4 billion yuan, up by 24.2 percent year-on-year.
7.Consumer Price Rose Mildly and Producer Prices for Industrial Products Remained at High Level.
The consumer price (CPI) went up by 0.5 percent year-on-year in the first half-year and maintained the same year-on-year in the first quarter. In June, the consumer price went up by 1.1 percent year-on-year, 0.2 percentage points slower than May, or down by 0.4 percent month on month. In the first half year, the consumer price went up by 0.6 percent in urban areas and 0.4 percent in rural areas. Grouped by commodity categories, prices for food, tobacco, and alcohol were up by 0.4 percent year-on-year; clothing the same year-on-year; housing up by 0.2 percent; articles and services for daily use up by 0.1 percent; transportation and communication up by 1.9 percent; education, culture, and recreation up by 0.9 percent; medical services and health care up by 0.3 percent; and other articles and services down by 1.1 percent. In terms of food, tobacco, and alcohol prices, prices for pork went down by 19.3 percent, grain up by 1.2 percent, fresh fruits up by 2.6 percent, and fresh vegetables up by 3.2 percent. Core CPI excluding the prices of food and energy went up by 0.4 percent; specifically, it maintained the same year-on-year in the first quarter.
In the first half-year, the producer prices for industrial products went up by 5.1 percent year-on-year, 3.0 percentage points faster than the first quarter. In June, it grew by 8.8 percent year-on-year, 0.2 percentage points slower than May. In the first half-year, the purchasing prices for industrial producers went up by 7.1 percent year-on-year, 4.3 percentage points faster than the first quarter. It went up by 13.1 percent year-on-year and 0.8 percent month-on-month in June.
8.Surveyed Unemployment Rate in Urban Areas Maintained the Same as Last Month and Employment Was Generally Stable.
In the first half-year, the newly increased employed people in urban areas totaled 6.98 million, which meant that 63.5 percent of the whole year target was achieved. In June, the surveyed unemployment rate in urban areas was 5.0 percent, the same as in May and 0.7 percentage points lower than the same period last year. The surveyed unemployment rate of population with local household registration was 5.0 percent and that of population with non-local household registration was 5.1 percent. Specifically, the surveyed unemployment rates of the population aged from 16 to 24 and from 25 to 59 were 15.4 percent and 4.2 percent, respectively. The urban surveyed unemployment rate in 31 major cities was 5.2 percent, the same as May. The employees of enterprises worked 47.6 hours per week on average, 0.3 hour more than May. By the end of the second quarter, the number of rural migrant workers totaled 182.33 million.
9.Resident Income Continued to Grow and Urban-Rural Per Capita Disposable Income Ratio Narrowed.
In the first half-year, the nationwide per capita disposable income of residents was 17,642 yuan, a nominal increase of 12.6 percent year-on-year as a result of the low base in the first half of last year, with an average two-year growth of 7.4 percent, 0.4 percentage points faster than the first quarter. The real growth was 12.0 percent year-on-year after deducting price factors which meant an average two-year growth of 5.2 percent, slightly slower than the economic growth but generally staying at the same speed. In terms of permanent residence, the per capita disposable income of urban households was 24,125 yuan, a nominal growth of 11.4 percent and a real growth of 10.7 percent year-on-year. The per capita disposable income of rural households was 9,248 yuan, a nominal growth of 14.6 percent and a real growth of 14.1 percent year-on-year. By sources of income, the net income from wage and salaries, net business income, net property income, and net transfer income grew by 12.1 percent, 17.5 percent, 15.0 percent, and 9.0 percent year-on-year nominally. The per capita income of urban households was 2.61 times that of rural households, 0.07 less than the same period last year. The median of the nationwide per capita disposable income was 14,897 yuan, an increase of 11.6 percent.
Generally speaking, the national economy in the first half-year continued to recover steadily with the sound growth momentum consolidated. However, we should also be aware that the epidemic continues to mutate globally and external instabilities and uncertainties abound. At home, the economic recovery is unbalanced and more efforts are needed to consolidate the foundation for the steady recovery of the development. At the next stage, with Xi Jinping Thought on Socialism with Chinese Characteristics for a New Era as the guideline and based on the decisions and arrangements of the Central Economic Working Conference and the Government Work Report, we will adhere to the general working guideline of making progress while maintaining stability, coordinate both the epidemic prevention and control and the economic and social development, continue to deepen the supply-side structural reform, and focus on unlocking the potential of domestic demand. We will double the efforts to help businesses to overcome difficulties and achieve development, accelerate the reform, and opening-up, coordinate and regulate with both the past and future in mind. We will keep the economy performing within an appropriate range, advance high-quality development solidly, and spare no efforts to fulfill the whole year targets and tasks for economic and social development.
Notes:
1. The average two-year growth is the geometric mean of the growth with the data of the same period in 2019 as the base.
2. The growth rates of gross domestic product, value added of industrial enterprises above designated size and its sub-items are real growth by using comparable prices. The growth rates of other indicators are nominal growth by using current prices unless otherwise specified.
3. According to the auto-revision function of the seasonal adjustment model, revisions were made to quarter-on-quarter growth of GDP and to month-on-month changes of the value added of industrial enterprises above designated size, investment in fixed assets (excluding rural households), and total retail sales of consumer goods. The revised figures, quarter-on-quarter GDP growth for the second quarter of 2021 and month-on-month changes of other indicators for June 2021 are as follows:
The quarter-on-quarter growth of GDP in 2020 and the first and second quarters of 2021 were -8.7 percent, 10.0 percent, 2.8 percent, 3.0 percent, 0.4 percent and 1.3 percent respectively.
4. Industrial enterprises above the designated size are industrial enterprises with annual revenue from principle business over 20 million yuan.
As industrial enterprises above the designated size change every year, to ensure the data comparability between years, the coverage of the data of the same period last year used for estimating year-on-year growth rates like that of products output, are as consistent as possible with the current period and different from the coverage of the data published last year. The main reasons are as follows: First, the statistical units change. Every year, some enterprises are included in the survey as they meet the threshold, while some enterprises are removed from the survey because of downsizing. Besides, enterprises that have newly gone into operation, been bankrupted, canceled their registrations or had their business licenses revoked also cause impact. Second, duplicated outputs across regions of enterprise groups have been removed based on the ad hoc surveys since duplication was found in the products output of some enterprise groups.
5. The Index of Services Production is the change of production in the reporting period compared to the base period with the price factors deducted.
6. The scope of the total retail sales of consumer goods includes all legal entities, establishments and self-employed individuals involved in retail trades or providing catering services. Specifically, businesses above the designated size include wholesale enterprises (businesses), retail enterprises (businesses) and lodging and catering enterprises (businesses) with annual revenue from principal business over 20 million yuan, 5 million yuan and 2 million yuan respectively.
As the wholesale, retail, and lodging and catering enterprises (businesses) above the designated size change every year, to ensure the data comparability between years, the coverage of the data of the same period last year used for estimating year-on-year growth rates like that of the retail sales of consumer goods by businesses above the designated size is consistent with the current period and different from the coverage of data published last year. The main reasons are as follows: every year, some enterprises (businesses) are included in the survey as they meet the threshold, while some enterprises (businesses) are removed from the survey because of downsizing. Besides, enterprises (businesses) that have newly gone into operation, been bankrupted, canceled their registrations or had their business licenses revoked also cause impact.
Online retail sales refer to the retail sales of goods and services realized through internet trading platforms (including self-built websites and third-party platforms). Goods and services include physical goods and non-physical goods (e.g. virtual goods and services).
The total retail sales of consumer goods include the online retail sales of physical goods, but not the non-physical goods.
7. The data of investment in fixed assets of the same period last year are revised according to statistical law enforcement as well as the regulations of statistical programs. The growth rates are calculated on a comparable basis.
8. Employed people refer to people aged 16 and above who have the ability to work and engage in gainful employment for remuneration payment or business income.
9. The median of the nationwide per capita disposable income of residents refers to the per capita disposable income of households which lies in the middle of all surveyed households ranked from low to high on the basis of per capita disposable income level.
10. Data of imports and exports are from the General Administration of Customs. Data of newly increased employed people in urban areas and urban registered unemployment rate are from the Ministry of Human Resources and Social Security.
11. Due to the round-off reasons, the subentries may not add up to the aggregate totals.
In case of any differences between English translation and the original Chinese text, the Chinese edition shall prevail.