


National Bureau of Statistics of China
24 October 2022
This year, faced with complex and challenging domestic and international environment and multiple shocks from factors beyond expectation, under the strong leadership of the Central Committee of the Communist Party of China with Comrade Xi Jinping at its core, all regions and departments adhered to the general principle of pursuing progress while maintaining stability, effectively coordinated the efforts of Covid-19 prevention and control and economic and social development, and accelerated the implementation of the policy package for stabilizing the economy and the follow-up measures based on the requirements of ensuring effective Covid-19 containment, economic stability and development security. As a result, the national economy sustained recovery against the pressure and showed sound momentum in the third quarter, notably better than the second quarter. The production and demands continued to improve, employment and prices were generally stable and people’s livelihood was strongly and effectively safeguarded. The national economy was generally performing within an appropriate range.
According to preliminary estimates, the gross domestic product (GDP) in the first three quarters reached 87,026.9 billion yuan, up by 3.0 percent year on year at constant price, or 0.5 percentage points faster than that in the first half year. By industry, the value added of the primary industry was 5,477.9 billion yuan, up by 4.2 percent year on year; that of the secondary industry was 35,018.9 billion yuan, up by 3.9 percent; and that of the tertiary industry was 46,530.0 billion yuan, up by 2.3 percent. By quarter, the GDP grew by 4.8 percent year on year in the first quarter, 0.4 percent in the second quarter and 3.9 percent in the third quarter. The GDP in the third quarter was up by 3.9 percent quarter on quarter.
1. Grain Production Showed Good Momentum and Animal Husbandry Grew Steadily.
In the first three quarters, the value added of agriculture (crop farming) witnessed a year-on-year increase of 3.8 percent. The total output of summer grain and early rice was 175.53 million tons, an increase of 1.55 million tons compared with the previous year, up by 0.9 percent. The sown area for autumn grain maintained stable with an increase, and a good harvest was expected. In the first three quarters, the output of pork, beef, mutton and poultry was 67.11 million tons, up by 4.4 percent year on year. Of this total, the output of pork, beef, poultry and mutton was up by 5.9 percent, 3.6 percent, 1.7 percent and 1.5 percent respectively. The output of milk was up by 7.7 percent and that of eggs up by 2.7 percent. At the end of the third quarter, the number of pigs registered in stock was 443.94 million, up by 1.4 percent year on year, among which 43.62 million were breeding sows. The number of pigs slaughtered was 520.30 million, a year-on-year increase of 5.8 percent.
2. Recovery of Industrial Production Sped Up while Equipment Manufacturing and High-tech Manufacturing Grew Fast.
The total value added of industrial enterprises above the designated size grew by 3.9 percent year on year in the first three quarters, 0.5 percentage points faster than that in the first half year. In terms of sectors, the value added of mining increased by 8.5 percent year on year, that of manufacturing increased by 3.2 percent, and that of production and supply of electricity, thermal power, gas and water increased by 5.6 percent. The value added of high-tech manufacturing and equipment manufacturing increased by 8.5 percent and 6.3 percent year on year respectively, 4.6 percentage points and 2.4 percentage points faster than that of the industrial enterprises above the designated size. An analysis by types of ownership showed that the value added of state holding enterprises was up by 3.6 percent year on year; that of share-holding enterprises was up by 4.9 percent; that of enterprises funded by foreign investors or investors from Hong Kong, Macao and Taiwan was down by 0.1 percent; and that of private enterprises was up by 3.4 percent. In terms of products, the production of new-energy automobiles and solar cells went up by 112.5 percent and 33.7 percent year on year respectively. In the third quarter, the value added of industrial enterprises above the designated size grew by 4.8 percent year on year, or 4.1 percentage points faster than that in the second quarter. In September, the value added of industrial enterprises above the designated size grew by 6.3 percent year on year, 2.1 percentage points faster than that in the previous month, or an increase of 0.84 percent month on month. In September, the Manufacturing Purchasing Managers' Index stood at 50.1 percent, 0.7 percentage points higher than the previous month, and the Production and Operation Expectation Index was 53.4 percent, 1.1 percentage points higher. In the first eight months, the total profits made by industrial enterprises above the designated size were 5,525.4 billion yuan, down by 2.1 percent year on year.
3. Service Sector Continued to Recover and Modern Service Industries Registered a Good Momentum of Growth.
In the first three quarters, the value added of service sector grew by 2.3 percent year on year, 0.5 percentage points faster than that in the first half year. Specifically, the value added of information transmission, software and information technology services and that of financial intermediation grew by 8.8 percent and 5.5 percent respectively. In the third quarter, the value added of service sector grew by 3.2 percent year on year, while that of the second quarter was down by 0.4 percent. The Index of Services Production went up by 0.1 percent year on year in the first three quarters. It was up by 1.3 percent year on year in September. In the first eight months, the business revenue of service enterprises above the designated size grew by 5.1 percent year on year, 0.9 percentage points faster than that in the first seven months. Specifically, that of enterprises engaged in information transmission, software and information technology services and health and social services increased by 8.2 percent and 8.7 percent respectively. In September, the Business Activity Index for Services stood at 48.9 percent. Specifically, the Business Activity Index for postal services, telecommunication, broadcast, television and satellite transmission services and monetary and financial services stayed within the high expansion range of 60.0 percent and above. From the perspective of market expectation, the Business Activity Expectation Index for Services was 56.1 percent.
4. Market Sales Improved Gradually and Sales of Goods for Basic Living Grew Fast.
In the first three quarters, the total retail sales of consumer goods reached 32,030.5 billion yuan, up by 0.7 percent year on year, while it was down by 0.7 percent year on year in the first half year. Analyzed by different areas, the retail sales of consumer goods in urban areas reached 27,775.3 billion yuan, up by 0.7 percent year on year, and that in rural areas reached 4,255.2 billion yuan, up by 0.9 percent. Grouped by consumption patterns, the retail sales of goods were 28,905.5 billion yuan, up by 1.3 percent year on year; the income of catering was 3,124.9 billion yuan, down by 4.6 percent. The consumption for basic living enjoyed good growth, with the retail sales of grain, oil and food and that of beverage by enterprises above the designated size up by 9.1 percent and 6.9 percent respectively. The online retail sales reached 9,588.4 billion yuan, up by 4.0 percent. Specifically, the online retail sales of physical goods were 8,237.4 billion yuan, up by 6.1 percent, accounting for 25.7 percent of the total retail sales of consumer goods. In the third quarter, the total retail sales of consumer goods grew by 3.5 percent year on year while that of the second quarter was down by 4.6 percent. Specifically, in September, the total retail sales of consumer goods grew by 2.5 percent year on year, or 0.43 percent month on month.
5. Investment in Fixed Assets Maintained Stable with an Increase and Investment in High-tech Industries Grew Fast.
In the first three quarters, the investment in fixed assets (excluding rural households) reached 42,141.2 billion yuan, up by 5.9 percent year on year. Specifically, the investment in infrastructure was up by 8.6 percent year on year; that in manufacturing grew by 10.1 percent, and that in real estate development down by 8.0 percent. By industry, the investment in the primary industry went up by 1.6 percent year on year, that in the secondary industry up by 11.0 percent, and that in the tertiary industry up by 3.9 percent. The private investment was up by 2.0 percent. The investment in high-tech industries grew by 20.2 percent. Specifically, the investment in high-tech manufacturing and high-tech services grew by 23.4 percent and 13.4 percent respectively. In terms of high-tech manufacturing, the investment in manufacturing of electronic and communication equipment and in manufacturing of medical equipment, measuring instrument and meter grew by 28.8 percent and 26.5 percent respectively. In terms of high-tech services, the investment in services for transformation of scientific and technological achievements and in research, development and design services went up by 22.1 percent and 18.7 percent respectively. The investment in social sectors went up by 13.2 percent. Specifically, the investment in health sector and education sector went up by 31.2 percent and 8.1 percent respectively. The floor space of commercial buildings sold was 1,014.22 million square meters, down by 22.2 percent year on year. The total sales of commercial buildings were 9,938.0 billion yuan, down by 26.3 percent. In the third quarter, the investment in fixed assets went up by 5.7 percent year on year, 1.5 percentage points faster than that in the second quarter. In September, the investment in fixed assets went up by 0.53 percent month on month.
6. Consumer Price Went up Mildly and Growth of Producer Prices for Industrial Products Slowed Down.
In the first three quarters, the consumer price index (CPI) grew by 2.0 percent year on year, 0.3 percentage points faster than that of the first half year. Grouped by commodity categories, prices for food, tobacco and alcohol went up by 1.9 percent year on year; clothing up by 0.6 percent; housing up by 1.0 percent; articles and services for daily use up by 1.1 percent; transportation and communication up by 5.9 percent; education, culture and recreation up by 2.0 percent; medical services and health care up by 0.7 percent; and other articles and services up by 1.3 percent. In terms of food, tobacco and alcohol prices, prices for grain went up by 2.7 percent, fresh vegetables up by 8.7 percent, and fresh fruits up by 13.5 percent. The core CPI excluding the prices of food and energy grew by 0.9 percent year on year. In the third quarters, the CPI went up by 2.6 percent year on year. In September, it went up by 2.8 percent year on year, or up by 0.3 percent month on month.
In the first three quarters, the producer prices for industrial products went up by 5.9 percent year on year, 1.8 percentage points slower than that of the first half year. The prices in the third quarter went up by 2.5 percent year on year. Specifically, the prices in September went up by 0.9 percent year on year, or down by 0.1 percent month on month. In the first three quarters, the purchasing prices for industrial producers went up by 8.3 percent year on year, 2.1 percentage points slower than that of the first half year. Specifically, the prices in September went up by 2.6 percent year on year, or down by 0.5 percent month on month.
7. Employment was Generally Stable.
In the first three quarters, the urban surveyed unemployment rate averaged 5.6 percent, in which that of the third quarter averaged 5.4 percent, 0.4 percentage points lower than that of the second quarter. In September, the urban surveyed unemployment rate was 5.5 percent, 0.2 percentage points higher than the previous month. The surveyed unemployment rate of population with local household registration was 5.4 percent; that of population with non-local household registration was 5.6 percent, among which, the rate of the population with non-local agricultural household registration was 5.5 percent. Specifically, the surveyed unemployment rates of the population aged from 16 to 24 and from 25 to 59 were 17.9 percent and 4.7 percent respectively. The urban surveyed unemployment rate in 31 major cities was 5.8 percent. The employees of enterprises worked 47.8 hours per week on average. By the end of the third quarter, the number of rural migrant workers totaled 182.70 million.
8. Residents Income Increased Steadily and Income of Rural Residents Grew Faster than that of Urban Residents.
In the first three quarters, the nationwide per capita disposable income of residents was 27,650 yuan, a nominal growth of 5.3 percent year on year; the real growth was 3.2 percent after deducting price factors, 0.2 percentage points faster than that of the first half year. In terms of permanent residence, the per capita disposable income of urban households was 37,482 yuan, a nominal growth of 4.3 percent year on year and a real growth of 2.3 percent; the per capita disposable income of rural households was 14,600 yuan, a nominal growth of 6.4 percent year on year and a real growth of 4.3 percent. In terms of income source, the nationwide per capita salary income, net business income, net property income and net income from transfers grew by 5.1 percent, 5.2 percent, 5.8 percent and 5.6 percent in nominal terms respectively. The median of the nationwide per capita disposable income of residents was 23,277 yuan with the nominal growth of 5.1 percent year on year.
Generally speaking, the national economy overcame the adverse impacts inflicted by multiple unexpected shocks. Major indicators restored stability and stayed within an appropriate range, while positive factors accumulated. However, we must be aware that with the external environment becoming increasingly complicated and severe, the foundation for domestic economic recovery is still not solid. At the next stage, we must follow the guidance of Xi Jinping Thought on Socialism with Chinese Characteristics for a New Era and fully study and implement the spirits of the 20th National Congress of the Communist Party of China. Following the requirements of containing the epidemic, stabilizing the economy and keeping development secure, we should effectively coordinate Covid-19 response with economic and social development, continue to ensure stability on six key fronts (employment, the financial sector, foreign trade, foreign investment, domestic investment, and expectations) and security in six key areas (job security, basic living needs, operations of market entities, food and energy security, stable industrial and supply chains, and the normal functioning of primary level governments), enhance the implementation of relevant policies, and unleash the policy effectiveness. We must shore up the market entities, stabilize employment and prices, expand effective demand, promote reform and stimulate vitality, so as to consolidate the foundation for economic recovery and development, keep the economy running within an appropriate range and endeavor to achieve the best results.
Notes:
1. The growth rate of GDP and its sub-items are calculated at constant prices. The growth rates of value added of industrial enterprises above designated size and its sub-items are calculated at comparable prices. Both are real growth rates. The growth rates of other indicators are nominal growth by using current prices unless otherwise specified.
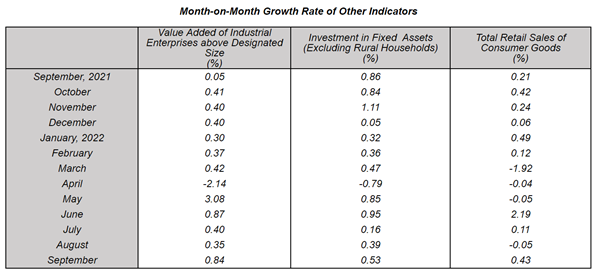
2. According to the auto-revision function of the seasonal adjustment model, revisions are made to quarter-on-quarter growth of GDP and to month-on-month changes of the value added of industrial enterprises above designated size, investment in fixed assets (excluding rural households), and total retail sales of consumer goods. The revised figures, quarter-on-quarter GDP growth for the third quarter of 2022 and month-on-month changes of other indicators for September 2022 are as follows:
The quarter-on-quarter growth of GDP since 2021 are 0.8 percent, 1.4 percent, 0.4 percent, 1.3 percent, 1.6 percent, -2.7 percent and 3.9 percent respectively.
3. Industrial enterprises above designated size are industrial enterprises with annual revenue from principal business over 20 million yuan.
As industrial enterprises above the designated size change every year, to ensure the data comparability between years, the coverage of the data of the same period last year used for estimating year-on-year growth rates like that of products output, are as consistent as possible with the current period and different from the coverage of the data published last year. The main reasons are as follows: First, the statistical units change. Every year, some enterprises are included in the survey as they meet the threshold, while some enterprises are removed from the survey because of downsizing. Besides, enterprises that have newly gone into operation, been bankrupted, canceled their registrations or had their business licenses revoked also cause impact. Second, duplicated outputs across regions of enterprise groups have been removed based on the ad hoc surveys since duplication is found in the products output of some enterprise groups.
4. The Index of Services Production is the change of production in the reporting period compared to the base period with the price factors deducted.
5. The scope of the total retail sales of consumer goods include all legal entities, establishments and self-employed individuals involved in retail trades or providing catering services. Specifically, businesses above the designated size include wholesale enterprises (businesses, self-employed individuals), retail enterprises (businesses, self-employed individuals) and lodging and catering enterprises (businesses, self-employed individuals) with annual revenue from principal business over 20 million yuan, 5 million yuan and 2 million yuan respectively.
As the wholesale, retail, and lodging and catering enterprises (businesses, self-employed individuals) above the designated size change every year, to ensure the data comparability between years, the coverage of the data of the same period last year used for estimating year-on-year growth rates like that of the retail sales of consumer goods by businesses above the designated size is consistent with the current period and different from the coverage of data published last year. The main reasons are: some enterprises (businesses, self-employed individuals) are included in the survey as they meet the threshold, while some enterprises (businesses, self-employed individuals) are removed from the survey because of downsizing every year. Besides, enterprises (businesses, self-employed individuals) that have newly gone into operation, been bankrupted, canceled their registrations or had their business licenses revoked also cause impact.
Online retail sales refer to the retail sales of goods and services realized through internet trading platforms (including self-built websites and third-party platforms). Goods and services include physical goods and non-physical goods (e.g. virtual goods and services).
The total retail sales of consumer goods include the online retail sales of physical goods, but not the non-physical goods.
6. Employed people refer to people aged 16 and above who have the ability to work and engage in gainful employment for remuneration payment or business income.
7. The median of the nationwide per capita disposable income of residents refers to the per capita disposable income of households which lies in the middle of all surveyed households ranked from low to high on the basis of per capita disposable income level.
8. Due to the rounding-off reasons, the subentries may not add up to the aggregate totals.
In case of any differences between English translation and the original Chinese text, the Chinese edition shall prevail.