


National Bureau of Statistics of China
16 April, 2025
In the first quarter, under the strong leadership of the Central Committee of the Communist Party of China (CPC) with Comrade Xi Jinping at its core, all regions and departments strictly implemented the decisions and arrangements made by the CPC Central Committee and the State Council, adhered to the general principle of pursuing progress while ensuring stability, fully and faithfully applied the new development philosophy on all fronts, accelerated the efforts to create a new pattern of development, took solid steps to promote high-quality development and made efforts to improve coordination of a full range of macro policies. As a result, the effects of policies continued to unfold, production and supply grew fast, cultivation of new quality productive forces were accelerated, domestic demands were increasing and employment was generally stable. The national economy was off to a good start and the high-quality development was advancing with new and positive momentum.
According to preliminary estimates, the gross domestic product (GDP) in the first quarter reached 31,875.8 billion yuan, up by 5.4 percent year on year at constant prices, or up by 1.2 percent over that in the fourth quarter of 2024. By industry, the value added of the primary industry was 1,171.3 billion yuan, up by 3.5 percent year on year; that of the secondary industry was 11,190.3 billion yuan, up by 5.9 percent; and that of the tertiary industry was 19,514.2 billion yuan, up by 5.3 percent.
1. Agricultural Production Showed Good Momentum and Animal Husbandry Grew Steadily.
In the first quarter, the value added of agriculture (crop farming) registered a year-on-year increase of 4.0 percent. The winter wheat maintained a stable sown area with a moderate increase and exhibited favorable growth in general. The spring farming and sowing were carried out in an orderly manner. According to the national planting intention survey, the intended sown area for rice and corn increased. In the first quarter, the output of pork, beef, mutton and poultry was 25.40 million tons, up by 2.0 percent year on year. Of this total, the output of pork, beef, and poultry grew by 1.2 percent, 2.7 percent and 5.1 percent respectively while that of mutton dropped by 5.1 percent. The output of milk was up by 1.7 percent and that of eggs down by 0.1 percent. At the end of the first quarter, the number of pigs registered in stock was 417.31 million, up by 2.2 percent year on year; and 194.76 million pigs were slaughtered, up by 0.1 percent in the first quarter.
2. Growth of Industrial Production Accelerated and Equipment Manufacturing and High-Tech Manufacturing Registered Fast Growth.
The total value added of industrial enterprises above the designated size grew by 6.5 percent year on year in the first quarter, 0.7 percentage points faster than that of 2024. In terms of sectors, the value added of mining increased by 6.2 percent year on year, that of manufacturing increased by 7.1 percent, and that of production and supply of electricity, heat power, gas and water increased by 1.9 percent. The value added of equipment manufacturing increased by 10.9 percent year on year, 3.2 percentage points faster than that of 2024. The value added of high-tech manufacturing increased by 9.7 percent, 0.8 percentage points faster. An analysis by types of ownership showed that the value added of state holding enterprises was up by 4.2 percent year on year; that of share-holding enterprises was up by 7.2 percent; that of enterprises funded by foreign investors or investors from Hong Kong, Macao and Taiwan was up by 4.0 percent; and that of private enterprises was up by 7.3 percent. In terms of products, the production of new energy vehicles, 3D printing devices and industrial robots grew by 45.4 percent, 44.9 percent and 26.0 percent year on year respectively. In March, the value added of industrial enterprises above the designated size went up by 7.7 percent year on year, 1.8 percentage points faster than that in the first two months, or up by 0.44 percent month on month. In March, the Manufacturing Purchasing Managers’ Index stood at 50.5 percent, 0.3 percentage points higher than that of the previous month. The Production and Operation Expectation Index was 53.8 percent. In the first two months, the total profits made by industrial enterprises above the designated size were 911.0 billion yuan, down by 0.3 percent year on year, a decline narrowed by 3.0 percentage points compared with that of 2024.
3. Service Sector Grew Fast and Modern Services Enjoyed Sound Growth.
In the first quarter, the value added of service sector went up by 5.3 percent year on year, 0.3 percentage points faster than that of 2024. Specifically, the value added of information transmission, software and information technology services, leasing and business services, transport, storage and postal services, wholesale and retail and accommodation and catering, grew by 10.3 percent, 10.2 percent, 7.2 percent, 5.8 percent and 5.1 percent respectively. In March, the Index of Services Production increased by 6.3 percent year on year, 0.7 percentage points faster than that in the first two months. Specifically, the Index of Services Production of information transmission, software and information technology services, leasing and business services, wholesale and retail and accommodation and catering went up by 9.9 percent, 9.3 percent, 7.7 percent and 6.0 percent respectively. In the first two months, the business revenue of service enterprises above the designated size grew by 8.2 percent year on year, 1.0 percentage point faster than that of 2024. In March, the Business Activity Index for Services stood at 50.3 percent, 0.3 percentage points higher than that of the previous month. The Business Activity Expectation Index for Services was 57.5 percent. 0.6 percentage points higher. Among which, the Business Activity Index for industries like water transportation, air transportation, postal services, telecommunication, broadcast, television and satellite transmission services and monetary and financial services stayed within the high expansion range of 55.0 percent and above.
4. Growth of Market Sales Picked up and Sales of Trade-in Goods Grew Fast.
In the first quarter, the total retail sales of consumer goods reached 12,467.1 billion yuan, up by 4.6 percent year on year, 1.1 percentage points faster than that of 2024. Analyzed by different areas, the retail sales of consumer goods in urban areas reached 10,805.7 billion yuan, up by 4.5 percent year on year, and that in rural areas stood at 1,661.4 billion yuan, up by 4.9 percent. Grouped by consumption patterns, the retail sales of goods were 11,064.4 billion yuan, up by 4.6 percent; the income of catering was 1,402.7 billion yuan, up by 4.7 percent. Sales of basic living goods and certain upgraded goods enjoyed sound growth. The retail sales of grain, oil and food, of daily necessities and of sports and recreational articles by enterprises above the designated size went up by 12.2 percent, 6.8 percent and 25.4 percent respectively. The effect of trade-in of consumer goods continued to manifest, with the retail sales of communication equipment, cultural and office supplies, household appliances and audio-visual equipment and furniture by enterprises above the designated size up by 26.9 percent, 21.7 percent, 19.3 percent and 18.1 percent respectively. The online retail sales reached 3,624.2 billion yuan, up by 7.9 percent year on year. Specifically, the online retail sales of physical goods were 2,994.8 billion yuan, up by 5.7 percent, accounting for 24.0 percent of the total retail sales of consumer goods. In March, the total retail sales of consumer goods went up by 5.9 percent year on year, 1.9 percentage points faster than that in the first two months, or up by 0.58 percent month on month. In the first quarter, the retail sales of services went up by 5.0 percent year on year.
5. Investment in Fixed Assets Remained Stable with a Moderate Increase and Investment in High-tech Industries Grew Fast.
In the first quarter, the investment in fixed assets (excluding rural households) reached 10,317.4 billion yuan, up by 4.2 percent year on year, 1.0 percentage point faster than that of the previous year; the investment in fixed assets was up by 8.3 percent with the investment in real estate development deducted. Specifically, the investment in infrastructure grew by 5.8 percent year on year; that in manufacturing grew by 9.1 percent; and that in real estate development declined by 9.9 percent. The floor space of newly-built commercial buildings sold was 218.69 million square meters, down by 3.0 percent year on year, a decline narrowed by 2.1 percentage points compared to that of the first two months; the total sales of newly-built commercial buildings were 2,079.8 billion yuan, down by 2.1 percent, a decline narrowed by 0.5 percentage points. By industry, the investment in the primary industry went up by 16.0 percent year on year, that in the secondary industry up by 11.9 percent, and that in the tertiary industry up by 0.1 percent. The private investment went up by 0.4 percent. Deducting the investment in real estate development, the private investment grew by 6.0 percent. The investment in high-tech industries grew by 6.5 percent year on year, of which the investment in information services, aerospace vehicle and equipment manufacturing, computer and office device manufacturing and professional technical services grew by 34.4 percent, 30.3 percent, 28.5 percent and 26.1 percent respectively. In March, the investment in fixed assets (excluding rural households) grew by 0.15 percent month on month.
6. Imports and Exports of Goods Maintained Growth and Trade Structure Continued to Optimize.
In the first quarter, the total value of imports and exports of goods was 10,301.3 billion yuan, an increase of 1.3 percent year on year. The total value of exports was 6,131.4 billion yuan, up by 6.9 percent. The total value of imports was 4,170.0 billion yuan, down by 6.0 percent. The imports and exports by private enterprises increased by 5.8 percent, accounting for 56.8 percent of the total value of the imports and exports, 2.4 percentage points higher than that of the same period last year. The exports of mechanical and electrical products grew by 8.7 percent. In March, the total value of imports and exports was 3,766.3 billion yuan, up by 6.0 percent year on year. The total value of exports was 2,251.5 billion yuan, up by 13.5 percent; that of imports was 1,514.8 billion yuan, down by 3.5 percent.
7. Consumer Price was Generally Stable and Producer Prices for Industrial Products Dropped.
In the first quarter, the consumer price index (CPI) dropped by 0.1 percent year on year. Grouped by commodity categories, prices for food, tobacco and alcohol went down by 0.7 percent; clothing up by 1.2 percent; housing up by 0.1 percent; articles and services for daily use down by 0.4 percent; transportation and communication down by 1.9 percent; education, culture and recreation up by 0.7 percent; medical services and health care up by 0.3 percent; and other articles and services up by 6.0 percent. In terms of food, tobacco and alcohol prices, the price for fresh vegetable went down by 5.9 percent, grain down by 1.4 percent, fresh fruit down by 0.1 percent and pork up by 8.1 percent. The core CPI excluding the prices of food and energy grew by 0.3 percent year on year. In March, the CPI went down by 0.1 percent year on year, a decline narrowed by 0.6 percentage points compared with that of the previous month, or down by 0.4 percent month on month.
In the first quarter, the producer prices for industrial products went down by 2.3 percent year on year. Specifically, the prices in March dropped by 2.5 percent year on year, or down by 0.4 percent month on month. In the first quarter, the purchasing prices for industrial producers went down by 2.3 percent year on year; specifically in March, the prices dropped by 2.4 percent year on year, or down by 0.2 percent month on month.
8. Employment was Generally Stable and Urban Surveyed Unemployment Rate Maintained Stable with a Slight Decline.
In the first quarter, the urban surveyed unemployment rate averaged 5.3 percent. In March, the surveyed unemployment rate in urban areas was 5.2 percent, 0.2 percentage points lower than that of the previous month. The surveyed unemployment rate of population with local household registration was 5.3 percent and that of population with non-local household registration was 4.9 percent, of which, the rate of population with non-local agricultural household registration stood at 5.0 percent. The urban surveyed unemployment rate in 31 major cities was 5.2 percent. The employees of enterprises worked 48.5 hours per week on average. By the end of the first quarter, the number of rural migrant workers totaled 187.95 million, up by 1.1 percent year on year.
9. Residents Income Increased Steadily and Income of Rural Residents Grew Faster than That of Urban Residents.
In the first quarter, the nationwide per capita disposable income of residents was 12,179 yuan, a nominal growth of 5.5 percent year on year; the real growth was 5.6 percent after deducting price factors. In terms of permanent residence, the per capita disposable income of urban households was 15,887 yuan, a nominal growth of 4.9 percent year on year and a real growth of 5.0 percent; the per capita disposable income of rural households was 7,003 yuan, a nominal growth of 6.2 percent year on year and a real growth of 6.5 percent. In terms of income source, the nationwide per capita salary income, net business income, net property income and net income from transfers grew by 5.9 percent, 5.7 percent, 2.7 percent and 5.5 percent in nominal terms respectively. The median of the nationwide per capita disposable income of residents was 9,939 yuan with a nominal growth of 5.0 percent year on year.
Generally speaking, in the first quarter, with the sustained effects of the macro policies, the national economy got off to a good and steady start and maintained the recovery momentum with innovation playing an increasingly leading role and the cultivation and development of new drivers accelerated. However, we should be aware that the external environment is becoming more complex and severe, the drive for the growth of effective domestic demand is insufficient, and the foundation for sustained economic recovery and growth is yet to be consolidated. At the next stage, we must follow the guidance of Xi Jinping Thought on Socialism with Chinese Characteristics for a New Era, strictly implement the decisions and arrangements made by the CPC Central Committee and the State Council, adhere to the general principle of pursuing progress while ensuring stability, fully and faithfully apply the new development philosophy on all fronts, accelerate the creation of a new pattern of development and take solid steps to promote high-quality development. We must implement more proactive and effective macro policies, expand and strengthen the domestic economy, fully stimulate the vitality of market entities of all types, and actively respond to the uncertainties of the external environment, so as to promote steady economic progress while ensuring sound and sustained growth.
Notes:
1. The growth rate of GDP and its sub-items are calculated at constant prices. The growth rates of value added of industrial enterprises above designated size and its sub-items are calculated at comparable prices. Both are real growth rates. The growth rates of other indicators are nominal growth by using current prices unless otherwise specified.
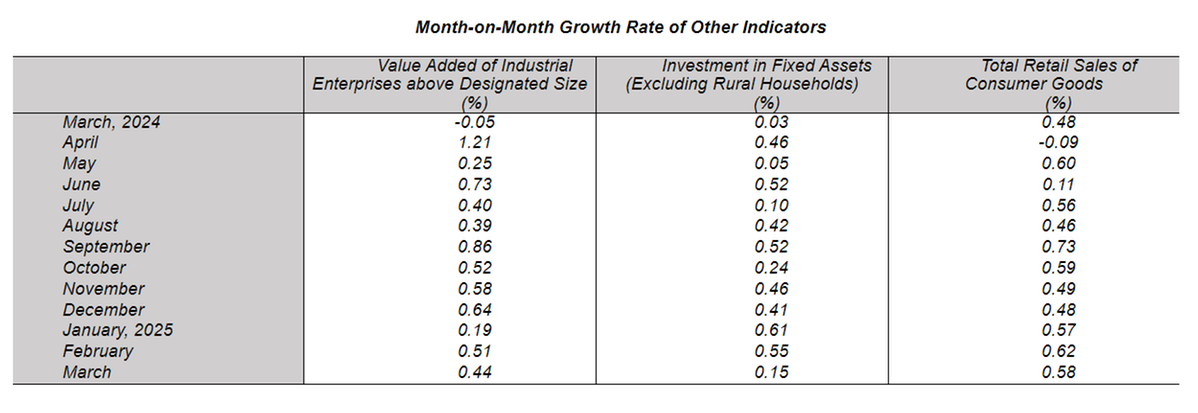
2. According to the auto-revision function of the seasonal adjustment model, revisions are made to quarter-on-quarter growth of GDP and to month-on-month changes of the value added of industrial enterprises above designated size, investment in fixed assets (excluding rural households), and total retail sales of consumer goods. The revised figures, quarter-on-quarter GDP growth for the first quarter of 2025 and month-on-month changes of other indicators for March 2025 are as follows:
The quarter-on-quarter growth of GDP in 2024 and in the first quarter of 2025 are 1.3 percent, 1.0 percent, 1.4 percent, 1.6 percent and 1.2 percent respectively.
3. Industrial enterprises above designated size are industrial enterprises with annual revenue from principal business over 20 million yuan.
As industrial enterprises above the designated size change every year, to ensure the data comparability between years, the coverage of the data of the same period last year used for estimating year-on-year growth rates like that of products output, is as consistent as possible with the current period and different from the coverage of the data published last year. The main reasons are as follows: First, the statistical units change. Every year, some enterprises are included in the survey as they meet the threshold, while some enterprises are removed from the survey because of downsizing. Besides, enterprises that have newly gone into operation, been bankrupted, canceled their registrations or had their business licenses revoked also cause impact. Second, duplicated outputs across regions of enterprise groups have been removed based on the ad hoc surveys since duplication is found in the products output of some enterprise groups.
4. The Index of Services Production is the change of production in the reporting period compared to the base period with the price factors deducted.
5. The scope of the total retail sales of consumer goods includes all legal entities, establishments and self-employed units involved in retail trades or providing catering services. Specifically, businesses above the designated size include wholesale enterprises (businesses, self-employed units), retail enterprises (businesses, self-employed units) and lodging and catering enterprises (businesses, self-employed units) with annual revenue from principal business over 20 million yuan, 5 million yuan and 2 million yuan respectively.
As the wholesale, retail, and lodging and catering enterprises (businesses, self-employed units) above the designated size change every year, to ensure the data comparability between years, the coverage of the data of the same period last year used for estimating year-on-year growth rates like that of the retail sales of consumer goods by businesses above the designated size is consistent with the current period and different from the coverage of data published last year. The main reasons are: some enterprises (businesses, self-employed units) are included in the survey as they meet the threshold, while some enterprises (businesses, self-employed units) are removed from the survey because of downsizing every year. Besides, enterprises (businesses, self-employed units) that have newly gone into operation, been bankrupted, canceled their registrations or had their business licenses revoked also cause impact.
Online retail sales refer to the retail sales of goods and services realized through internet trading platforms (including self-built websites and third-party platforms). Goods and services include physical goods and non-physical goods (e.g. virtual goods and services).
The total retail sales of consumer goods include the online retail sales of physical goods, but not the non-physical goods.
Data of total retail sales of consumer goods and online retail sales were revised according to the result of the Fifth National Economic Census. The monthly growth rates of relevant indicators of total retail sales of consumer goods and online retail sales in 2025 are calculated on a comparable basis.
6. The retail sales of services refer to the total value of services directly provided by enterprises (establishments, self-employed units) to individuals and other units for non-production and non-operating purposes in the form of transactions. It aims to reflect the value of services with the nature of consumption sold by service providers in monetary terms, including the retail sales of services in transportation, accommodation, catering, education, health, sports, entertainment, and other fields.
7. Data of investment in fixed assets of the same period last year were revised according to the results of methodology reform of investment statistics, the Fifth National Economic Census and the statistical law enforcement. The growth rates of investment in fixed assets are calculated on a comparable basis.
8. Data of imports and exports are from the General Administration of Customs.
9. Employed people refer to people aged 16 and above who have the ability to work and engage in gainful employment for remuneration payment or business income.
10. The median of the nationwide per capita disposable income of residents refers to the per capita disposable income of households which lies in the middle of all surveyed households ranked from low to high on the basis of per capita disposable income level.
11. Due to the rounding-off reasons, the subentries may not add up to the aggregate totals.
In case of any differences between English translation and the original Chinese text, the Chinese edition shall prevail.