


National Bureau of Statistics of China
October 18, 2021
In the first three quarters, faced with complicated and severe environment both at home and abroad, under the strong leadership of the Central Committee of the Communist Party of China (CPC) with Comrade Xi Jinping at its core, all regions and departments strictly implemented the decisions and arrangements made by the CPC Central Committee and the State Council, coordinated both the epidemic prevention and control and the economic and social development in a scientific manner, enhanced cross-cyclical adjustment of macro policies and effectively responded to multiple tests of epidemic and floods. As a result, the national economy sustained its recovery and development with all major macro economic indicators falling in the reasonable range. The overall social situation was harmonious and stable with generally stable employment, increased residents’ income, balanced international payments, adjusted and optimized economic structure and steadily improved quality and efficiency.
According to the preliminary estimates, the gross domestic product (GDP) in the first three quarters reached 82,313.1 billion yuan, a year-on-year increase of 9.8 percent at comparable prices, with an average two-year growth of 5.2 percent, 0.1 percentage point lower than the average two-year growth of the first half year. By quarter, the GDP for the first quarter increased by 18.3 percent year-on-year, with an average two-year growth of 5.0 percent; for the second quarter 7.9 percent year-on-year, with an average two-year growth of 5.5 percent; and for the third quarter 4.9 percent year-on-year, with an average two-year growth of 4.9 percent. By industry, for the first three quarters, the value added of the primary industry was 5,143.0 billion yuan, up by 7.4 percent year-on-year, or an average two-year growth of 4.8 percent; that of the secondary industry was 32,094.0 billion yuan, up by 10.6 percent year-on-year, or an average two-year growth of 5.7 percent; and that of the tertiary industry was 45,076.1 billion yuan, up by 9.5 percent year-on-year, or an average two-year growth of 4.9 percent. The quarter-on-quarter GDP for the third quarter increased by 0.2 percent.
1.Agricultural Production Showed Good Momentum and Production of Animal Husbandry Grew Fast.
In the first three quarters, the value added of agriculture (crop farming) went up by 3.4 percent year-on-year, with an average two-year growth of 3.6 percent. The total output of summer grain and early rice totaled 173.84 million tons (347.7 billion jin), 3.69 million tons (7.4 billion jin) higher than that of last year, up by 2.2 percent. The sown area for autumn grain was stable with an increase. Of the total, the sown area for corn increased considerably; major crops for autumn grain grew well and another bumper harvest is expected for the year. In the first three quarters, the output of pork, beef, mutton and poultry was 64.28 million tons, up by 22.4 percent year-on-year. Specifically, the output of pork, beef, mutton and poultry was up by 38.0 percent, 5.3 percent, 3.9 percent and 3.8 percent year-on-year respectively; that of milk went up by 8.0 percent year-on-year and eggs down by 2.4 percent. At the end of the third quarter, the number of pigs registered in stock was 437.64 million, up by 18.2 percent year-on-year, among which 44.59 million were breeding sows, up by 16.7 percent.
2.Industrial Production Continued to Grow and Business Efficiency Improved Steadily.
In the first three quarters, the total value added of industrial enterprises above the designated size grew by 11.8 percent year-on-year, or an average two-year growth of 6.4 percent. In September, the total value added of industrial enterprises above the designated size increased by 3.1 percent year-on-year, with an average two-year growth of 5.0 percent; or up by 0.05 percent month on month. In terms of sectors, in the first three quarters, the value added of mining increased by 4.7 percent year-on-year; that of manufacturing increased by 12.5 percent; and the production and supply of electricity, thermal power, gas and water increased by 12.0 percent. The value added of high-tech manufacturing went up by 20.1 percent year-on-year, with an average two-year growth of 12.8 percent. In terms of products, the production of new-energy automobiles, industrial robots and integrated circuits increased by 172.5 percent, 57.8 percent and 43.1 percent year-on-year respectively, with the average two-year growths all exceeding 28 percent. An analysis by types of ownership showed that in the first three quarters, the value added of state holding enterprises was up by 9.6 percent year-on-year; that of share-holding enterprises up by 12.0 percent; that of enterprises funded by foreign investors or investors from Hong Kong, Macao and Taiwan up by 11.6 percent; and that of private enterprises up by 13.1 percent. In September, the Manufacturing Purchasing Managers’ Index (PMI) stood at 49.6 percent, of which the PMI of high-tech manufacturing was 54.0 percent, 0.3 percentage point higher than that of last month; the Production and Operation Expectation Index was 56.4 percent.
In the first eight months, the total profits made by industrial enterprises above the designated size totaled 5,605.1 billion yuan, up by 49.5 percent year-on-year, or an average two-year growth of 19.5 percent; the profit rate of the business revenue of industrial enterprises above the designated size was 7.01 percent, 1.20 percentage points higher than last year.
3.Service Sector Recovered Steadily and Modern Service Industries Grew Well.
The first three quarters witnessed a steady recovery of the tertiary industry. Specifically, in the first three quarters, the value added of information transmission, software and information technology services and transportation, storage and postal services increased by 19.3 percent and 15.3 percent year-on-year respectively, with an average two-year growth of 17.6 percent and 6.2 percent respectively. In September, the Index of Services Production grew by 5.2 percent year-on-year, 0.4 percentage point higher than that in August; or an average two-year growth of 5.3 percent, 0.9 percentage point higher. In the first eight months, the business revenue of service enterprises above the designated size grew by 25.6 percent year-on-year, with an average two-year growth of 10.7 percent.
In September, the Business Activity Index for Services stood at 52.4 percent, 7.2 percentage points higher than that in August. Specifically, the Business Activity Index for railway transportation, air transportation, accommodation, catering, ecological protection and environment treatment, those hit hard by the epidemic and flood in August, all rebounded significantly to the level above the threshold. From the perspective of market expectation, the Business Activity Expectation Index for services stood at 58.9 percent, 1.6 percentage points higher than that of last month. Of the total, the Business Activity Expectation Index for sectors like railway transportation, air transportation and express mail service exceeds 65.0 percent.
4.Market Sales Continued to Grow with Sales of Upgraded Goods and Basic Living Goods Increasing Fast.
In the first three quarters, the total retail sales of consumer goods reached 31,805.7 billion yuan, up by 16.4 percent year-on-year, with an average two-year growth of 3.9 percent. In September, the total retail sales of consumer goods was 3,683.3 billion yuan, up by 4.4 percent year-on-year, 1.9 percentage points higher than that in August; an average two-year growth of 3.8 percent, 2.3 percentage points higher than that in August; the month-on-month growth was 0.30 percent. Analyzed by different areas, for the first three quarters, the retail sales of consumer goods in urban areas reached 27,588.8 billion yuan, up by 16.5 percent year-on-year, or an average two-year growth of 3.9 percent; and that in rural areas rose by 15.6 percent year-on-year to 4,216.9 billion yuan, with an average two-year growth of 3.8 percent. Grouped by consumption patterns, for the first three quarters, the retail sales of goods were 28,530.7 billion yuan, up by 15.0 percent year-on-year, or an average two-year growth of 4.5 percent; and the revenue of catering was 3,275.0 billion yuan, up by 29.8 percent year-on-year, or an average two-year decline of 0.6 percent. Grouped by categories, the retail sales of gold, silver and jewelry, sports and recreational articles, cultural and office supplies and other upgraded consumer goods by enterprises above the designated size went up by 41.6 percent, 28.6 percent and 21.7 percent year-on-year respectively; that of basic goods like beverage, clothes, shoes, hats, and textiles and daily necessities went up by 23.4 percent, 20.6 percent and 16.0 percent year-on-year respectively. The online retail sales of the first three quarters reached 9,187.1 billion yuan, up by 18.5 percent year-on-year. Specifically, the online retail sales of physical goods totaled 7,504.2 billion yuan, up by 15.2 percent year-on-year, accounting for 23.6 percent of the total retail sales of consumer goods.
5.Investment in Fixed Assets Scaled up and Investment in High-tech Industries and Social Sector Grew Fast.
In the first three quarters, the investment in fixed assets (excluding rural households) reached 39,782.7 billion yuan, up by 7.3 percent over that of last year, with an average two-year growth of 3.8 percent; the month-on-month growth in September was 0.17 percent. Specifically, the investment in infrastructure in the first three quarters was up by 1.5 percent year-on-year, an average two-year growth of 0.4 percent;manufacturing up by 14.8 percent year-on-year, an average two-year growth of 3.3 percent; and real estate development up by 8.8 percent year-on-year, an average two-year growth of 7.2 percent. The floor space of commercial buildings sold reached 1,303.32 million square meters, up by 11.3 percent year-on-year, an average two-year growth of 4.6 percent. The total sales of commercial buildings were 13,479.5 billion yuan, up by 16.6 percent year-on-year, an average two-year growth of 10.0 percent. By industries, in the first three quarters, the investment in the primary industry went up by 14.0 percent year-on-year; that in the secondary industry up by 12.2 percent year-on-year; and that in the tertiary industry grew by 5.0 percent year-on-year. The private investment went up by 9.8 percent year-on-year, an average two-year growth of 3.7 percent. The investment in high-tech industries grew by 18.7 percent year-on-year, an average two-year growth of 13.8 percent. Specifically, the investment in high-tech manufacturing and high-tech services grew by 25.4 percent and 6.6 percent year-on-year respectively. In terms of high-tech manufacturing, the investment in manufacturing of computers and office devices and in manufacturing of aerospace vehicle and equipment grew by 40.8 percent and 38.5 percent year-on-year respectively. In terms of high-tech services, the investment in E-commerce services and in testing services went up by 43.8 percent and 23.7 percent year-on-year respectively. The investment in social sectors went up by 11.8 percent year-on-year, with an average two-year growth of 10.5 percent. Specifically, the investment in health and education went up by 31.4 percent and 10.4 percent year-on-year respectively.
6.Imports and Exports of Goods Grew Fast and Trade Structure Continued to Improve.
In the first three quarters, the total value of imports and exports of goods was 28,326.4 billion yuan, up by 22.7 percent year-on-year. Specifically, the value of exports was 15,547.7 billion yuan, up by 22.7 percent and the value of imports was 12,778.7 billion yuan, up by 22.6 percent. The trade balance was 2,769.1 billion yuan in surplus. In September, the total value of imports and exports of goods was 3,532.9 billion yuan, a year-on-year increase of 15.4 percent. Specifically, the value of exports was 1,983.0 billion yuan, up by 19.9 percent; that of imports was 1,549.8 billion yuan, up by 10.1 percent. In the first three quarters, the exports of mechanical and electrical products grew by 23 percent year-on-year, 0.3 percentage point higher than the overall export growth rate, accounting for 58.8 percent of the total value of exports. The imports and exports of general trade accounted for 61.8 percent of the total value of imports and exports, 1.4 percentage points higher than the same period last year. The imports and exports by private enterprises grew by 28.5 percent year-on-year, accounting for 48.2 percent of the total value of imports and exports.
7.Consumer Price Went up Mildly and Increase of Producer Prices for Industrial Products Expanded.
In the first three quarters, the consumer price (CPI) went up by 0.6 percent year-on-year, 0.1 percentage point higher than that in the first half of this year. Specifically, in September, the consumer price went up by 0.7 percent year-on-year, 0.1 percentage point lower than that in August; the same as August month on month. In the first three quarters, the consumer price rose by 0.7 percent in urban areas and up by 0.4 percent in rural areas. Grouped by commodity categories, in the first three quarters, prices for food, tobacco and alcohol went down by 0.5 percent year-on-year; clothing up by 0.2 percent; housing up by 0.6 percent; articles and services for daily use up by 0.2 percent; transportation and communication up by 3.3 percent; education, culture and recreation up by 1.6 percent; medical services and health care up by 0.3 percent; other articles and services down by 1.6 percent. Among the prices for food, tobacco and alcohol, the prices for pork went down by 28.0 percent, grain up by 1.0 percent, fresh vegetables up by 1.3 percent and fresh fruits up by 2.7 percent. Core CPI of the first three quarters excluding the price of food and energy went up by 0.7 percent, an increase expanded by 0.3 percentage point compared with that of the first half of this year.
In the first three quarters, the producer prices for industrial products went up by 6.7 percent, an increase expanded by 1.6 percentage points than that of the first half of this year. Specifically, the prices in September went up by 10.7 percent year-on-year, or up by 1.2 percent month on month. In the first three quarters, the purchasing prices for industrial producers went up by 9.3 percent year-on-year, an increase expanded by 2.2 percentage points than that of the first half of this year. Specifically, the prices in September went up by 14.3 percent, or up by 1.1 percent month on month.
8.Employment Was Basically Stable and Urban Surveyed Unemployment Rate Was Stable with Moderate Decline.
In the first three quarters, the newly increased employed people in urban areas totaled 10.45 million, achieving 95.0 percent of the annual target. In September, the urban surveyed unemployment rate was 4.9 percent, 0.2 percentage point lower than August and 0.5 percentage point lower than the same period last year. The surveyed unemployment rate of population with local household registration was 5.0 percent and that of population with non-local household registration was 4.8 percent. The surveyed unemployment rates of the population aged from 16 to 24 and from 25 to 59 were 14.6 percent and 4.2 percent respectively. The urban surveyed unemployment rate in 31 major cities was 5.0 percent, 0.3 percentage point lower than August. The employees of enterprises worked 47.8 hours per week on average, up by 0.3 hour compared with that in August. At the end of the third quarter, the number of rural migrant workers totaled 183.03 million, up by 0.7 million compared with that at the end of the second quarter.
9.Residents’ Income Grew in Tandem with the Economy and Urban-Rural Per Capita Income Ratio Narrowed.
In the first three quarters, the nationwide per capita disposable income of residents was 26,265 yuan, a nominal increase of 10.4 percent year-on-year, with an average two-year growth of 7.1 percent, or a real increase of 9.7 percent year-on-year after deducting price factors, with an average two-year growth of 5.1 percent, which was generally at the same pace as the growth of economy. In terms of permanent residence, the per capita disposable income of urban households was 35,946 yuan, a nominal increase of 9.5 percent year-on-year and a real increase of 8.7 percent; the per capita disposable income of rural households was 13,726 yuan, a nominal increase of 11.6 percent year-on-year and a real increase of 11.2 percent. By sources of income, the net income from wages and salary, net business income, net property income and net transfer income saw a year-on-year growth of 10.6 percent, 12.4 percent, 11.4 percent and 7.9 percent in nominal terms respectively. The per capita disposable income of urban households was 2.62 times that of the rural households, 0.05 less than the same period last year. The median of the nationwide per capita disposable income was 22,157 yuan, a nominal increase of 8.0 percent year-on-year.
Generally speaking, the overall national economy maintained the recovery momentum in the first three quarters with steady progress in economic restructuring and new advancement of high-quality development. However, we must note that the current international environment uncertainties are mounting and the domestic economic recovery is still unstable and uneven. At the next stage, we must take Xi Jinping Thought on Socialism with Chinese Characteristics for a New Era as the guideline, implement the decisions and arrangements made by the CPC Central Committee and the State Council, adhere to the general working guideline of making progress while maintaining stability, fully and faithfully implement the new development philosophy on all fronts, expedite the building of a new development pattern, carry out the routine epidemic prevention and control, strengthen cross-cyclical adjustment of macro policies, make efforts to promote sustained and healthy economic development, focus on deepening the reform and opening-up and innovation, continuously stimulate market vitality, strengthen development momentum and unleash the potential of domestic demand, so as to maintain the economy operating within the proper range and fulfil the major annual targets and tasks for the economic and social development.
Notes:
1.The average two-year growth is the geometric mean of the growth with the data of the same period in 2019 as the base.
2.The growth rate of GDP and value added of industrial enterprises above designated size and its sub-items are real growth by using comparable prices. The growth rates of other indicators are nominal growth by using current prices unless otherwise specified.
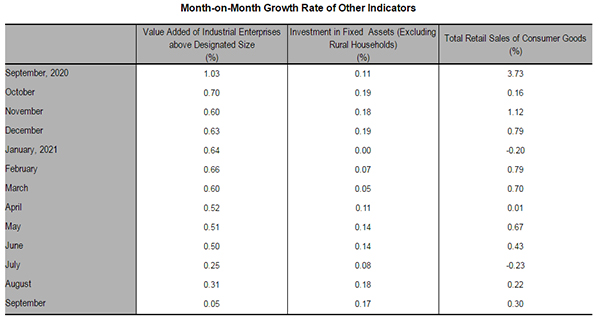
3.According to the auto-revision function of the seasonal adjustment model, revisions are made to quarter-on-quarter growth of GDP and to month-on-month changes of the value added of industrial enterprises above designated size, investment in fixed assets (excluding rural households), and total retail sales of consumer goods. The revised figures, quarter-on-quarter GDP growth for the third quarter of 2021 and month-on-month changes of other indicators for September 2021 are as follows:
The quarter-on-quarter growth of GDP in 2020 and in the first three quarters of 2021 are -9.5 percent, 10.7 percent, 2.9 percent, 3.2 percent, 0.2 percent, 1.2 percent and 0.2 percent respectively.
4.Industrial enterprises above designated size are industrial enterprises with annual revenue from principal business over 20 million yuan.
As industrial enterprises above the designated size change every year, to ensure the data comparability between years, the coverage of the data of the same period last year used for estimating year-on-year growth rates like that of products output, are as consistent as possible with the current period and different from the coverage of the data published last year. The main reasons are as follows: First, the statistical units change. Every year, some enterprises are included in the survey as they meet the threshold, while some enterprises are removed from the survey because of downsizing. Besides, enterprises that have newly gone into operation, been bankrupted, canceled their registrations or had their business licenses revoked also cause impact. Second, duplicated outputs across regions of enterprise groups have been removed based on the ad hoc surveys since duplication is found in the products output of some enterprise groups.
5.The Index of Services Production is the change of production in the reporting period compared to the base period with the price factors deducted.
6.The scope of the total retail sales of consumer goods include all legal entities, establishments and self-employed individuals involved in retail trades or providing catering services. Specifically, businesses above the designated size include wholesale enterprises (businesses), retail enterprises (businesses) and lodging and catering enterprises (businesses) with annual revenue from principal business over 20 million yuan, 5 million yuan and 2 million yuan respectively.
As the wholesale, retail, and lodging and catering enterprises (businesses) above the designated size change every year, to ensure the data comparability between years, the coverage of the data of the same period last year used for estimating year-on-year growth rates like that of the retail sales of consumer goods by businesses above the designated size is consistent with the current period and different from the coverage of data published last year. The main reasons are: some enterprises (businesses) are included in the survey as they meet the threshold, while some enterprises (businesses) are removed from the survey because of downsizing every year. Besides, enterprises (businesses) that have newly gone into operation, been bankrupted, canceled their registrations or had their business licenses revoked also cause impact.
Online retail sales refer to the retail sales of goods and services realized through internet trading platforms (including self-built websites and third-party platforms). Goods and services include physical goods and non-physical goods (e.g. virtual goods and services).
The total retail sales of consumer goods include the online retail sales of physical goods, but not the non-physical goods.
7.Data of investment in fixed assets of the same period last year are revised according to the results of statistical law enforcement and inspection and regulations of statistical survey programs. The growth rates are calculated on a comparable basis.
8.Employed people refer to people aged 16 and above who have the ability to work and engage in gainful employment for remuneration payment or business income.
9.The median of the nationwide per capita disposable income of residents refers to the per capita disposable income of households which lies in the middle of all surveyed households ranked from low to high on the basis of per capita disposable income level.
10.Data of imports and exports are from the General Administration of Customs; data of newly increased employed people in urban areas are from the Ministry of Human Resources and Social Security.
11.Due to the rounding-off reasons, the subentries may not add up to the aggregate totals.
In case of any differences between English translation and the original Chinese text, the Chinese edition shall prevail.